Twelve Tabs Won't Tell You What to Do Monday
A weekly marketing metrics board for solo founders: five numbers, CAC and ROAS gates, content KPIs that predict signups, and a Friday ritual that replaces dashboard tourism.
 By Reese28 min read
Listen to this article
AI-generated podcast-style overview of this article (not a word-for-word narration).
It was a Tuesday, which meant I had already opened Google Analytics twice, checked Twitter impressions once, and refreshed Stripe for no reason. I could tell you pageviews were up eleven percent. I could not tell you whether that mattered, which channel deserved another week of effort, or what I should do differently on Monday. I had twelve tabs and zero decisions.
That is the normal state of marketing when you are the only employee. You inherit dashboards built for teams: traffic by source, social reach, email list growth, ad platform summaries, maybe a PostHog board you peek at when you remember. Each tab whispers that you should care. None of them tells you what to change next week. Solo founder marketing metrics weekly review is not about collecting more numbers. It is about shrinking the set until each number forces an action.
This piece is the board I wish someone had handed me before I burned a month celebrating impressions while trials flatlined. One spreadsheet. Five marketing numbers. CAC and ROAS gates before you touch the ad budget dial. Content KPIs that predict next month's signups, not last week's vanity. If you need the broader playbook first, read micro-SaaS marketing for solo founders. If you are drowning in product analytics tabs, Max's micro-SaaS analytics solo founder guide covers activation and retention on a different day. This is the marketing half of the house, reviewed on Fridays, in thirty minutes, with one sentence before you close the laptop.
The difference between founders who grow and founders who stall is rarely talent. It is whether they can name what changed last week without opening twelve apps. I have coached founders who could quote MRR to the penny but could not tell me which blog post assisted a signup. I have also coached founders with messy spreadsheets who could tell me exactly why they sent forty DMs on Monday. Guess which group bought more ads responsibly. The board is bias toward the second group.
Marketing metrics for a solo founder are not smaller versions of enterprise KPIs. Enterprise KPIs assume specialists, budgets, and meetings where someone challenges the chart. You are the specialist, the budget, and the meeting. Weekly review is how you simulate the meeting without hiring the head of growth you cannot afford yet.
Solo founder marketing metrics weekly: why one board beats twelve tabs
The failure mode is not ignorance. It is overload dressed up as diligence. You check numbers because checking feels like work. Checking is not work. Deciding is work, and deciding requires a board small enough that you cannot hide.
A weekly marketing metrics board is a deliberate constraint. You pick five numbers that describe whether strangers are finding you, whether the finding turns into trials, whether paid spend earns its keep, and whether content is compounding. You update them once. You compare to last week and last month. You write one sentence: what changes next week. That sentence is the product of the review. Everything else is input.
I learned this after a founder I advised showed me his "marketing dashboard." Fourteen widgets. Beautiful colors. He spent forty minutes every Sunday updating it and could not name a single experiment he had run because of it. We deleted eleven widgets in one call. The next month he finally noticed that Reddit replies converted at four times the rate of his newsletter. He had the data before. He did not have a board that made the data argue with itself.
Weekly rhythm matters because marketing at solo scale is slow. A blog post needs six weeks to rank. A community channel needs repetition before anyone trusts you. Paid tests need enough spend to learn, not enough to hurt. Daily checks mostly measure mood. Weekly checks measure direction. Monthly checks measure whether the direction was real or a blip.
Separate days
Keep marketing Friday and product analytics on a different day if you can. Mixing acquisition and activation in one sitting turns into scrolling. Scrolling is not a review.
The board also protects you from channel FOMO. Someone on Twitter will post a screenshot of MRR climbing from threads. Someone on LinkedIn will swear reels are mandatory. Your board is the antidote. If threads are not on the board, they are not your strategy this month. If reels never show up in assisted signups, they are a hobby. That sounds harsh. It is also how you finish building the product instead of becoming a full-time content creator with a side project.
What weekly does not mean
Weekly does not mean you ignore urgent fires. If ads spend triples because of a broken pixel, fix it today. If a post drives a support meltdown, read the comments today. The board is for pattern recognition, not incident response.
Weekly also does not mean you need fancy tooling. A Google Sheet with five rows and a date column beats a $200 analytics suite you never configure. The board is an agreement with yourself about what earns a row. Tools are just how you fill the cells.
I keep a template tab called board and a history tab called weeks so I can scroll back without rebuilding charts. History is how you spot lies. A channel that looked hot for one week is noise. A channel that wins six of eight weeks is strategy. Without history, you are always living in the latest mood.
Who this weekly board is for
This rhythm assumes you have something to measure: a landing page, a trial or signup flow, and at least one active acquisition channel you are trying on purpose. If you are pre-launch, the board is premature. Go validate first. If you are post-launch with zero traffic, the board will be zeros, which is still data: your problem is distribution, not instrumentation. If you have steady signups but no idea which week mattered, you are exactly who this is for.
The vanity pile vs the operator board
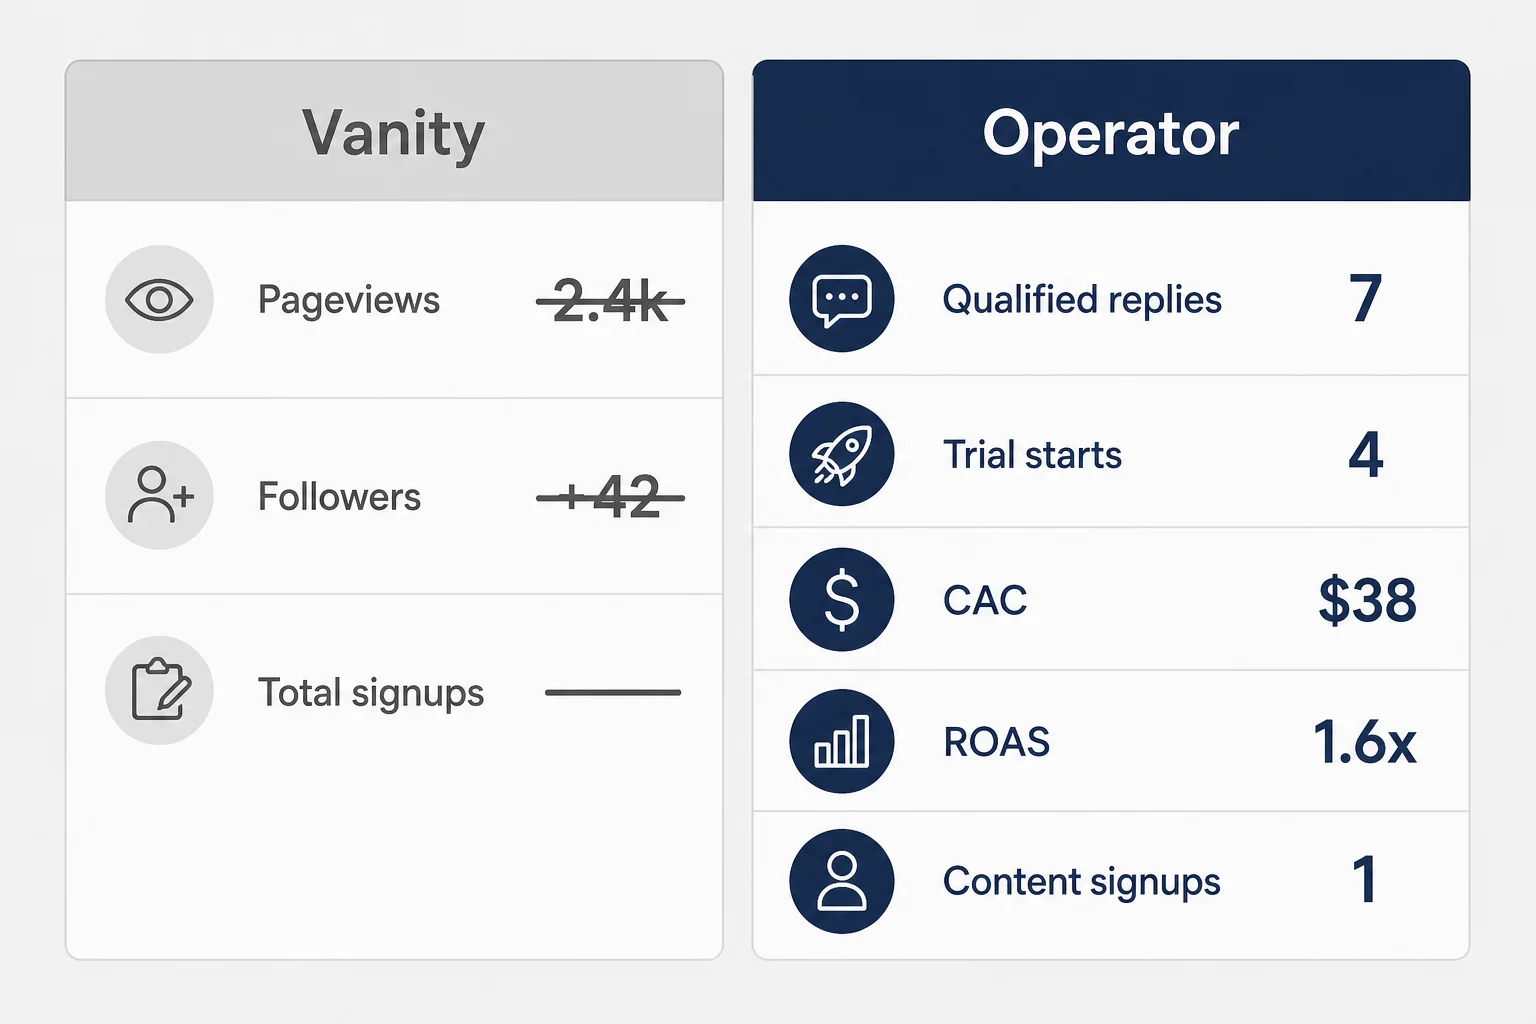
Vanity metrics are comfortable because they usually go up. Impressions climb. Followers accumulate. Total signups is a cumulative scoreboard that never admits defeat. You can have a great week on vanity metrics while revenue stalls, because vanity metrics are not obligated to connect to money.
Operator metrics connect to money or to the next action that might lead to money. A qualified reply is someone who could buy. A trial start from your top channel tells you whether that channel deserves another week. CAC tells you whether paid acquisition is a machine or a bonfire. ROAS tells you whether to turn the dial or walk away. A content-assisted signup tells you which article to update instead of writing a fourth intro to the same topic.
The tell is simple. Ask what you would do if the number dropped twenty percent. If the honest answer is "panic but not change anything," it is vanity. If the answer is "pause ads," "rewrite the landing page," "post in the community again," or "kill that keyword," it is operator.
I still catch myself building vanity piles. Last quarter I added a widget for email open rate even though I send almost no campaigns. Opens went up. Nobody signed up because of opens. The widget made me feel like an email marketer. I was a founder procrastinating on outreach. I removed the widget. The shame was useful.
The three vanity traps solo founders fall into
The first trap is total signups without source or quality. One hundred signups sounds better than eighty until you learn that seventy came from a listicle mention that bounces in nine seconds. Totals hide composition. Your board wants composition.
The second trap is social reach without assisted conversions. Ten thousand impressions on a thread is a nice screenshot. If zero trials credited that URL, the thread was entertainment. Entertainment is fine on purpose. It is not fine when you confuse it with distribution.
The third trap is blended CAC across channels that should never be blended. Organic outreach CAC is mostly time. Paid CAC is cash. Blending them into one pretty dollar figure lets bad paid spend hide behind good organic work. Split the rows. Let each channel defend itself.
Vanity piles also show up in team habits you adopt without a team. You install a CRM because a podcast said pipeline. You track MQLs even though you are the only SDR. You copy a VP's Monday metrics meeting into a Notion doc that nobody reads, including you. Solo marketing metrics should feel slightly too small. If the board impresses a stranger, it is probably too big.
A scene I keep repeating
Say you run a $39/month tool for Etsy sellers. A viral tweet sends four hundred profile visits. Vanity dashboard smiles. Operator board asks: how many trials started, from which URL, and did any of them activate. If the answer is six trials and one activation, the tweet was marketing weather, not a channel. You might still reply in the thread. You should not rebuild the roadmap around it. That distinction saves quarters.
Operator boards also change how you talk to yourself. Instead of "traffic was up," you say "Reddit drove four trials, two activated, one paid." That sentence contains a next action. Maybe you post again in that subreddit. Maybe you fix onboarding because activation halved. Vanity language ends in feelings. Operator language ends in calendars.
The five numbers on your weekly marketing board
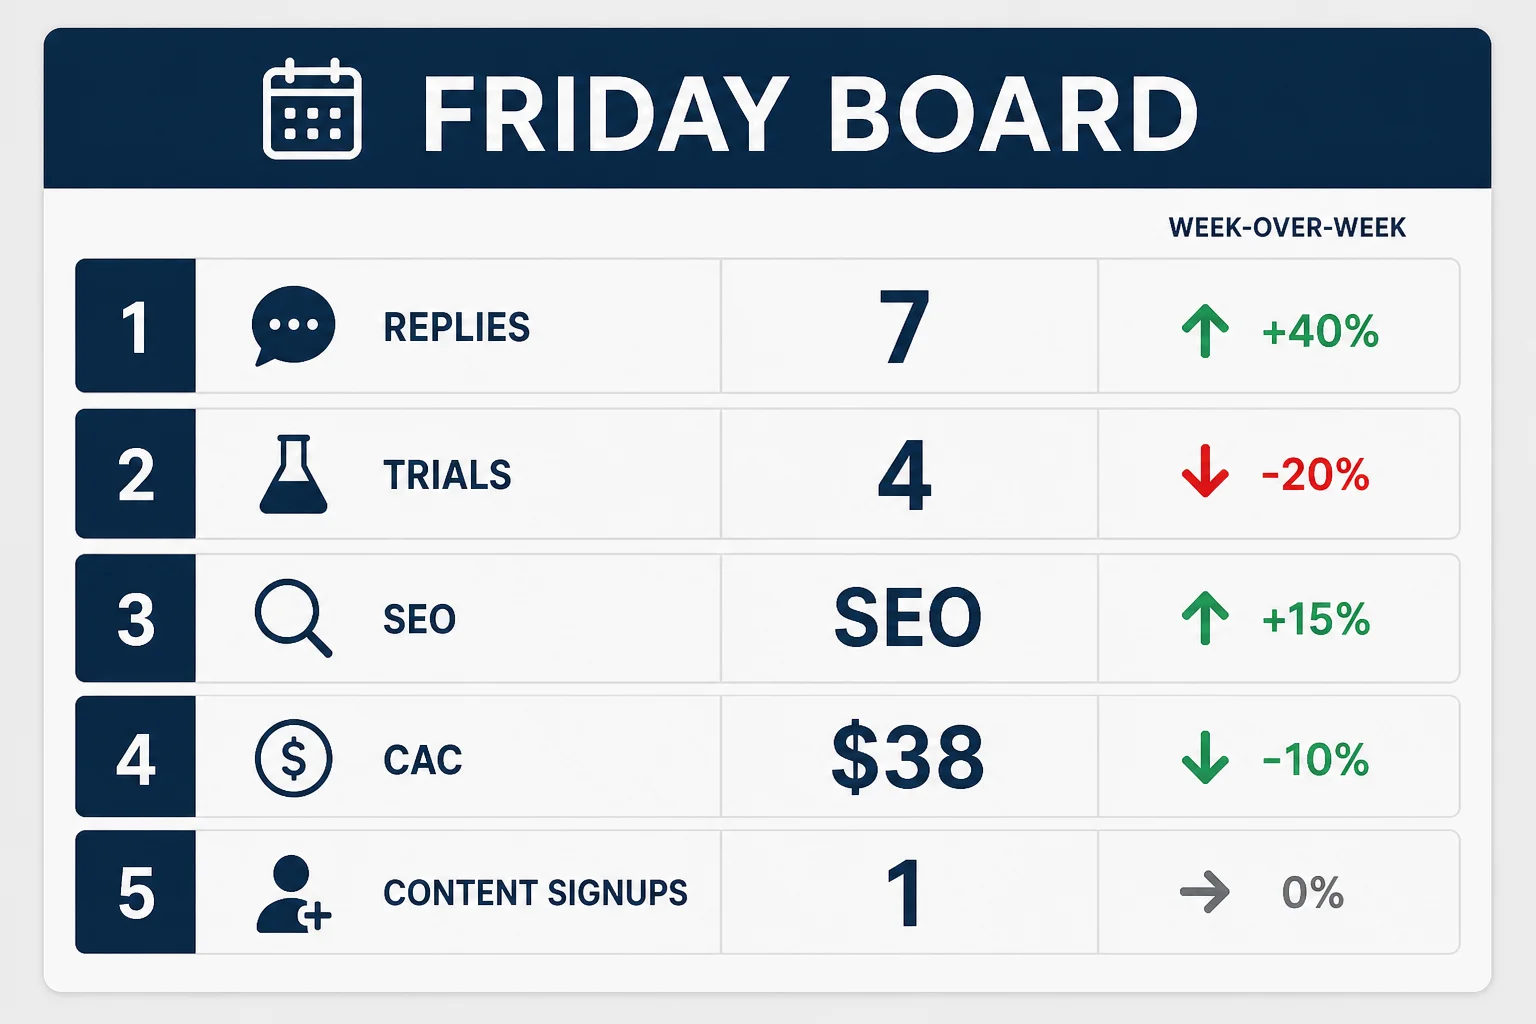
Here is the default board I give founders who already have a landing page and at least a trickle of signups. Customize labels to your business, but keep the count at five until you have a hundred paying customers and a real reason to add a sixth row.
Qualified replies counts conversations that could realistically become customers this month. Not every DM. Not every "cool project" comment. A reply where someone described a problem, asked a pricing question, or requested a demo counts. For community marketing, count thread replies that led to a profile click or a signup within seven days if you can attribute it. For cold email, count positive replies, not sends.
New trials or signups from top channel forces you to name the channel honestly. SEO, Reddit, LinkedIn, referrals, ads: pick whichever drove the most new trials this week and put that number in the cell. Next week, compare both the number and the channel name. Channel drift is data. If your top channel changes every week, you are spraying, not learning.
CAC (paid only) belongs on the board only when you spent money on acquisition this week or this month. Formula: total paid spend divided by new paying customers from paid in the same window. Round to the nearest dollar. If spend was $120 and you got two customers, CAC is $60. If spend was $120 and you got zero customers, write "undefined" and treat that as the decision.
ROAS (paid only) is revenue from paid-attributed customers divided by paid spend, gross before Stripe fees, measured on a thirty-day rolling window once you have enough conversions. One conversion is not a window. Three or more is a start. Below 1.0x means you are buying revenue at a loss before fees. That can be okay in a short test. It is not okay as a lifestyle.
Content-assisted signups is the number of trials or signups where the first touch or last touch was a specific blog post, guide, or landing page you control. Plausible and PostHog both help here. If you cannot attribute yet, count manual self-reports from onboarding ("how did you hear about us") and accept imperfection until instrumentation catches up.
Those five numbers sound modest. That is the point. Modest boards get updated. Ambitious dashboards become wallpaper.
How to score the week in one color
I use a lazy traffic-light system. Green means the number improved or held steady while quality improved. Yellow means flat or ambiguous. Red means down week-over-week and you know why, or down and you do not know why. Red with a known cause (you paused ads on purpose) is fine. Red with no story means you skipped learning.
Do not average the colors into a mood score. One red row should produce one sentence in the "next week" box. That is discipline.
Examples by channel so the rows feel real
If your primary channel is cold email, qualified replies might be "four positive replies from forty sends to agency owners." Top channel might still be email with two trials if one reply converted. CAC row stays blank until you pay for a list or run ads. Content row might be zero, and that is fine if email is the bet.
If your primary channel is SEO, qualified replies might be zero because nobody emails you back from Google. Top channel is organic search with three trials. Content-assisted signups might be two from the same refund-export post. CAC is blank unless you also run search ads. ROAS only appears when spend appears.
If your primary channel is Reddit, qualified replies might be six thread conversations with profile clicks. Top channel is Reddit with five trials. Content might assist one signup when you linked a guide instead of the homepage. The board should reflect that shape without forcing email metrics onto a community-led business.
The mistake is copying someone else's row labels because their screenshot looked professional. Your board should look slightly wrong to an outsider and perfectly obvious to you.
CAC math when your budget is lunch money
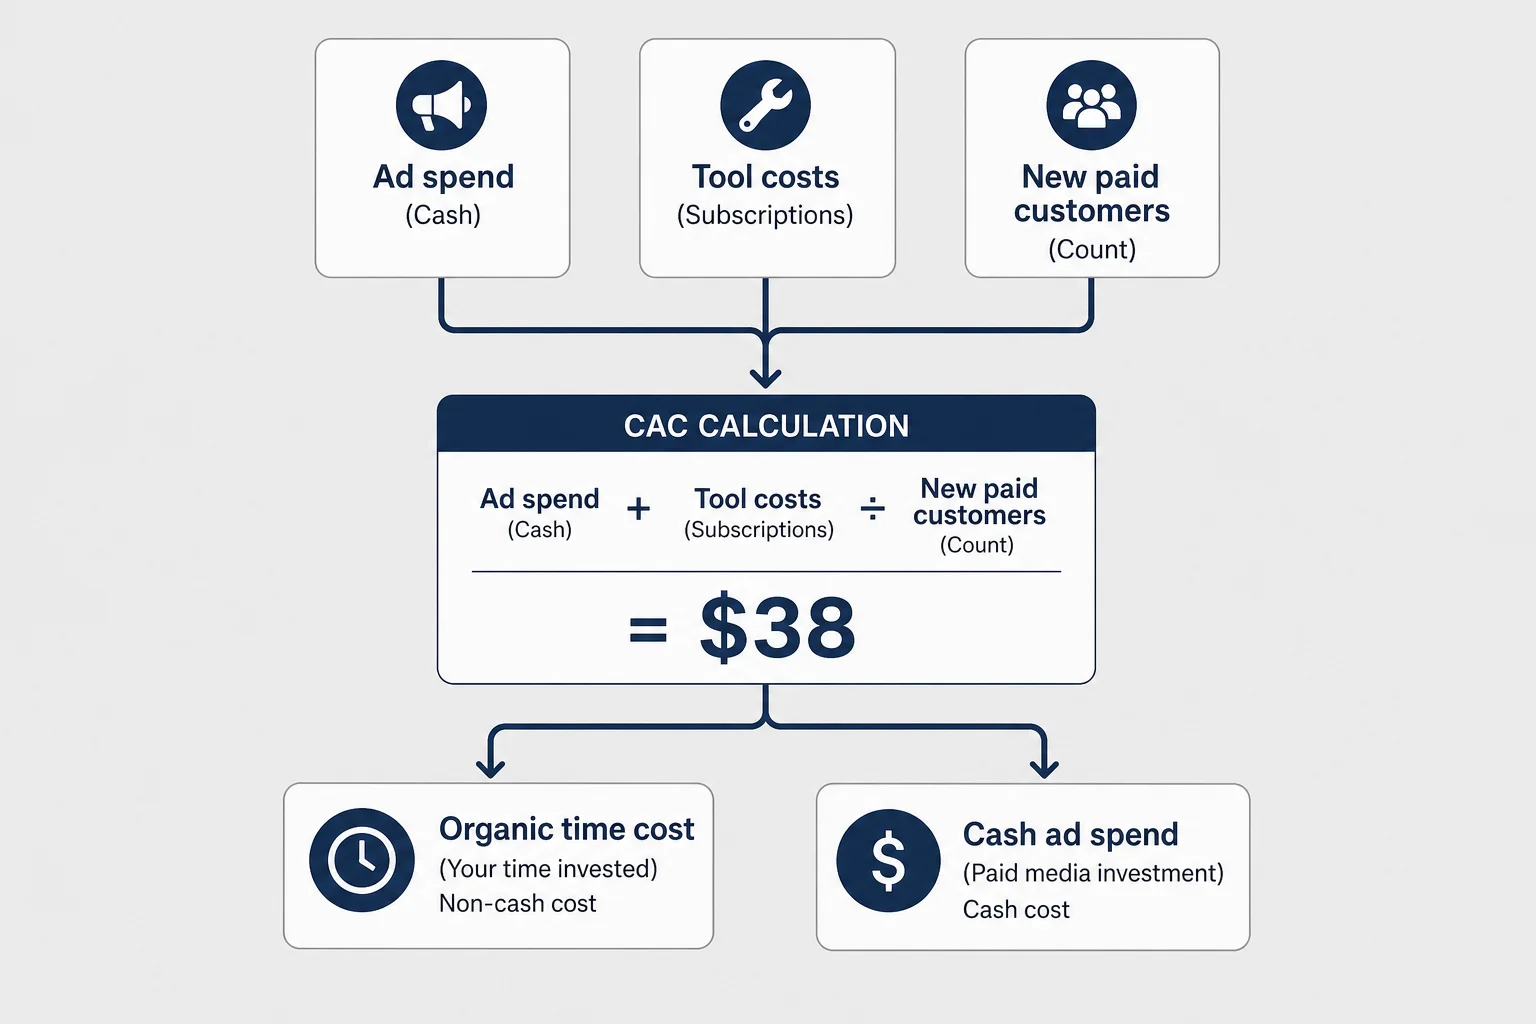
CAC panic hits solo founders early because the number looks enormous when denominators are tiny. Spend $200 on ads, get one customer at $49 a month, and your spreadsheet screams that CAC is $200. It is. That does not automatically mean stop. It means ask what you learned for $200 that you could not learn for free.
At solo scale, calculate CAC in two lanes. Cash CAC is ad spend plus direct tool costs divided by new paying customers from paid sources. Include the landing page A/B tool if you bought it for ads. Do not include your entire SaaS stack. Fully loaded CAC adds a time cost: hours spent on the channel times whatever honest rate you would pay a freelancer. Fully loaded hurts. That is why it is useful. It stops you from pretending free outreach is free when it ate your only build day.
When outreach is your channel, cash CAC might be near zero while fully loaded CAC is high. That is not wrong. It is a trade. You are buying customers with time instead of cash. The board should show that trade so you do not double-book yourself.
Undefined CAC is a valid cell. If you ran ads and got trials but no paid conversions, write "undefined" and note trial count. Trials are leading indicators. Paying customers are the lagging indicator you care about. Founders who hide undefined CAC behind trial vanity are delaying a decision they already have.
CAC gates before you keep spending
I use three gates. Gate one: cash CAC must be below three times your average first-month gross revenue for monthly plans, or below one times first-year gross for annual-heavy products. Gate two: you must have at least three paid conversions in the window or you are still in test mode, not scale mode. Gate three: fully loaded CAC must be below the cash CAC threshold OR you explicitly choose time spend because cash is scarce. Violating gate three on purpose is fine. Violating it by accident is how founders burn quarters.
If CAC is high but trials are strong, the problem is often onboarding or pricing, not ads. Send those people to product analytics instead of cranking spend. Marketing's job ended at the click. Product's job started at signup.
Worked example with small numbers
Imagine you spent $150 on Google Ads over two weeks and acquired one new customer on a $49 monthly plan. Cash CAC is $150. First-month gross revenue is $49, so you are underwater on month one. That is normal. The question is payback: if they stay four months on average, gross revenue is $196 and the ad roughly paid back before churn. You will not know average stay from one customer. That is why gate two demands three conversions before you treat CAC as stable.
Now add time. You spent six hours writing ad copy and landing variants. At a honest $50/hour freelance rate, fully loaded CAC is $150 plus $300 equals $450. Still one customer. The board forces you to admit that "quick ad test" was not quick. You might still choose that trade. You should choose it with eyes open.
Organic outreach in the same fortnight might show fully loaded CAC of $200 with two customers and cash CAC near zero. Comparing the rows side by side is how you decide whether next week is more DMs or another ad creative iteration. Without the split, you would average the numbers into a story that helps nobody.
ROAS gates before you scale paid spend
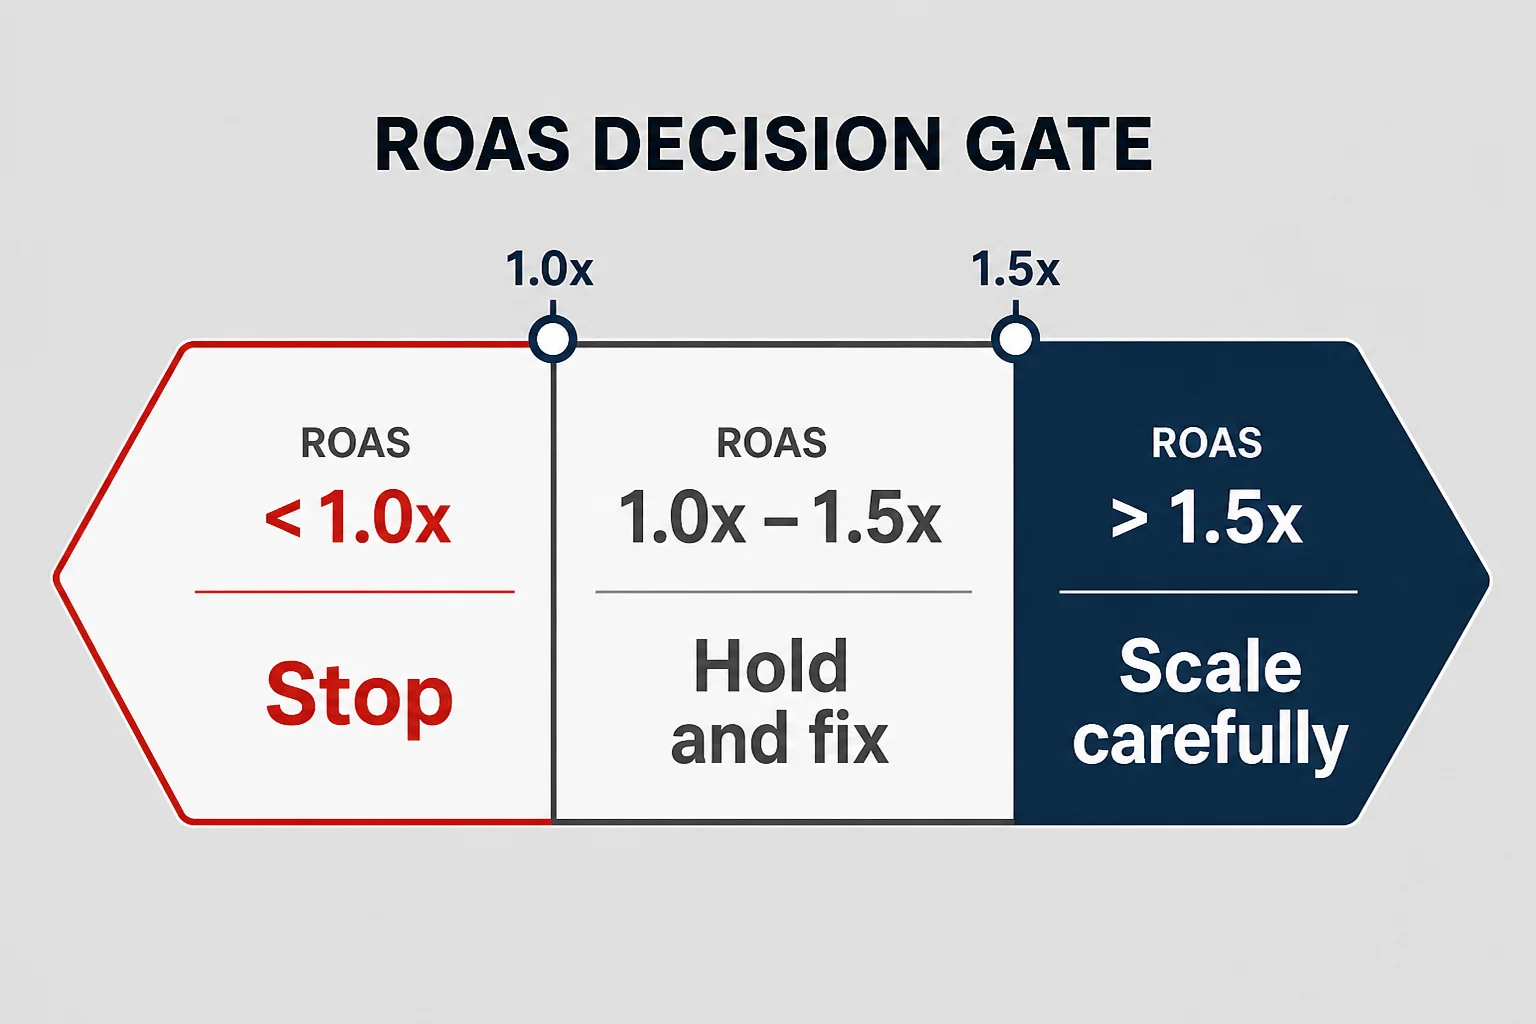
ROAS is where marketing meets arithmetic without romance. Return on ad spend asks a blunt question: for every dollar you put in, how many dollars came back out in gross revenue from customers you can attribute to ads? Not MRR on a chart. Cash from people who paid after clicking an ad, within your attribution window. When you are ready to run paid tests with intent, the profitable paid ads for micro-SaaS solo founders guide pairs with this board: the board tells you whether to hold or scale; that piece tells you how to structure the test loop.
Solo founders should default to a thirty-day click window and a conservative attribution model. Last-click is imperfect. It is also legible. Fancy attribution belongs to teams with data engineers. You have a spreadsheet.
My ROAS ladder looks like this. Below 1.0x, you are paying for revenue at a loss before fees. Acceptable only in a time-boxed test with a written hypothesis. Between 1.0x and 1.5x, you are learning but not scaling. Keep spend flat. Fix landing pages. Tighten keywords. Improve onboarding if trials convert poorly. Above 1.5x for three consecutive weeks with at least ten conversions total, you may increase spend ten to twenty percent and watch CAC drift.
Above 2.0x, solo founders still should not yolo the credit card. Double spend and you often double auction pressure, attract worse clicks, or hit audience saturation. Scale in steps. Write down the spend cap before you open the ads manager. The cap is a promise to future you, who will be tired.
ROAS without retention context is a trap. If customers churn in week two, great ROAS this month is a refund problem next month. Before you scale, glance at week-four retention for ad-sourced customers versus organic. If ads bring bargain hunters who leave, ROAS is lying. That check lives in product analytics, which is why Friday marketing review and Monday product review should not be the same meeting with yourself.
When to ignore ROAS entirely
Ignore ROAS when you are not running ads. Do not compute imaginary ROAS for organic to feel rigorous. Ignore ROAS when you have fewer than three paid conversions in the window. The number will be 4.2x or 0.3x based on luck. Ignore ROAS when your product price changed during the window unless you segment before and after.
If you are pre-revenue and testing landing pages, measure cost per trial instead of ROAS. ROAS needs dollars in the numerator. Trials-only tests are valid. Pretending they are ROAS is not.
How annual plans distort ROAS
Annual prepay makes ROAS look heroic for a week. You spent $100 and someone paid $290 for the year. Spreadsheet says 2.9x. Celebrate carefully. If monthly buyers churn fast but annual buyers were already convinced, you may be buying a skewed cohort. Segment ROAS by plan type once you have enough rows. Solo founders skip this and then wonder why scaled spend stopped working in month four.
Also subtract refunds from the revenue side if refunds spike after annual promos. Net ROAS is the operator number. Gross ROAS is the vanity number ads platforms show you to keep spending.
Content KPIs that predict next month's signups
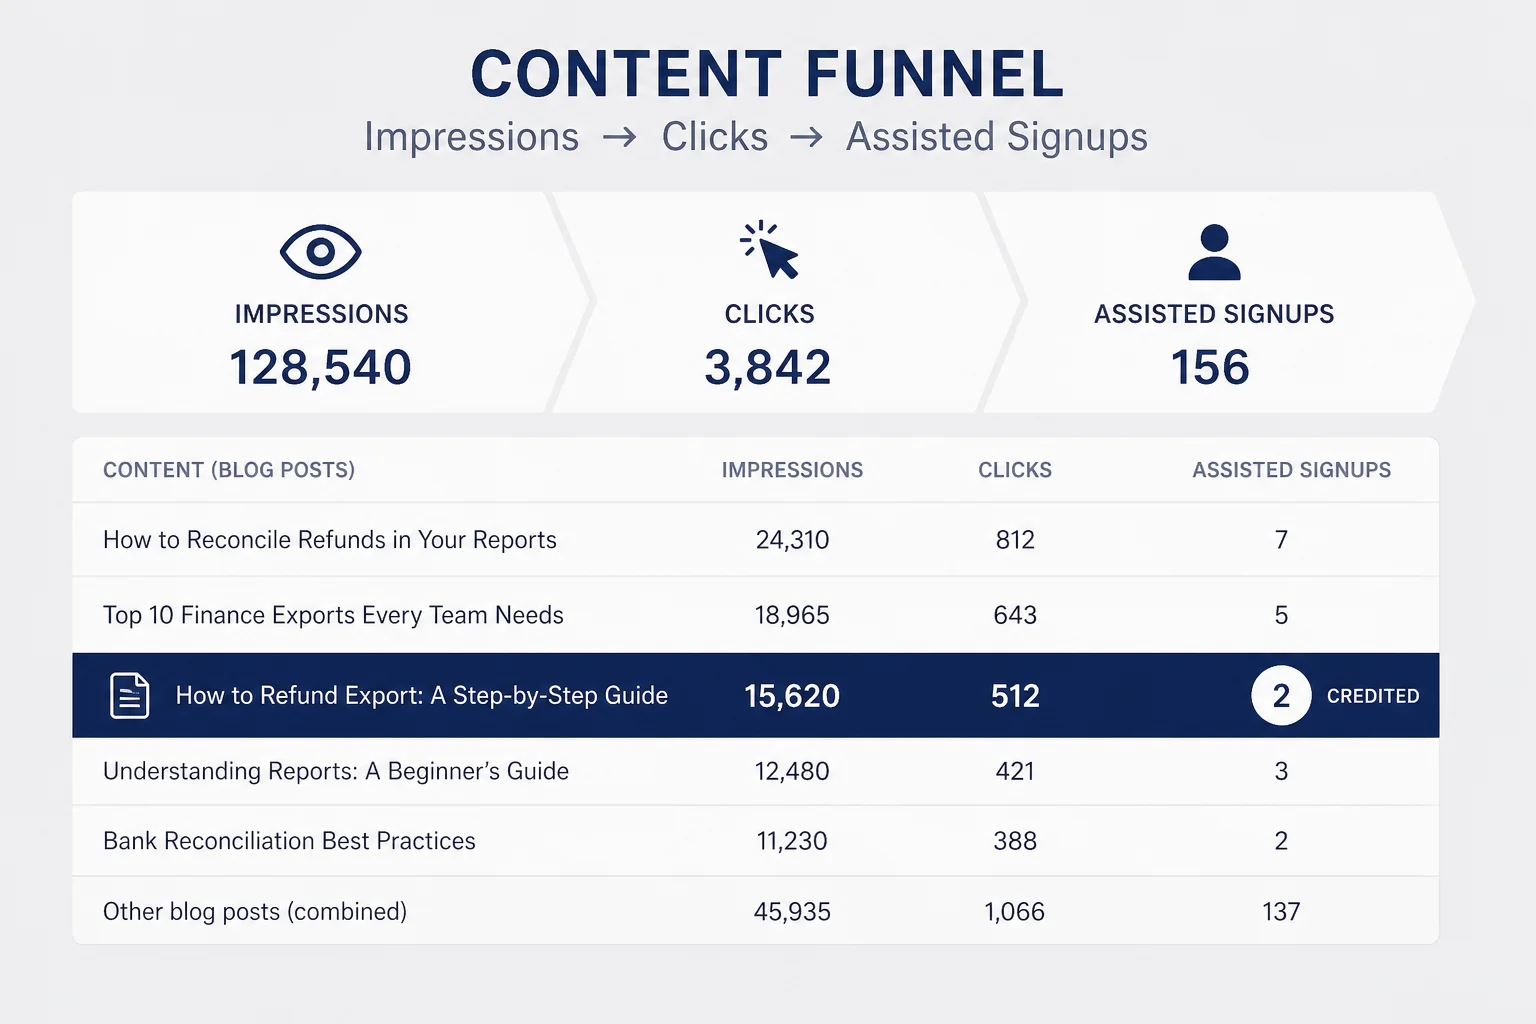
Content marketing fails solo founders in a predictable way. They publish, they check pageviews, they feel productive, they never connect a post to a signup. Pageviews are top-of-funnel weather. Assisted signups are the forecast that matters.
My content row on the weekly board is not "total blog traffic." It is assisted signups from the best-performing post in the last thirty days, plus a note field with the target keyword or community thread that post serves. If the best post assisted zero signups, the note explains why it still matters (new post, ranking build) or flags it for rewrite.
Secondary content KPIs belong in a monthly appendix, not on the five-number board. Search Console impressions for your primary keyword. Average position movement. Email captures if you gate a PDF. Time on page for your money page. Those inform rewrites. They should not crowd out whether anyone paid.
A post that ranks position four and assists two signups a month is a asset. A post that ranks position four and assists zero signups is a positioning or CTA problem. A post with two hundred pageviews and one signup from a niche community link might be more valuable than a post with three thousand pageviews and zero signups. The board forces that comparison weekly so you do not rewrite the wrong article.
The content decision tree I actually use
If impressions are up and assisted signups are flat, tighten the intro and CTA first. Do not add six H2s. If impressions are flat and position is stuck on page two, update freshness, add internal links, and check whether the keyword matches buyer intent. If a post assists signups but traffic is tiny, double down on distribution in communities where that post solves a visible question. If nothing assists after ninety days, archive or merge it. Dead content rots your crawl budget and your attention.
Content KPIs should talk to CAC. Organic-assisted signups lower blended acquisition cost even when cash CAC is zero. That is why splitting paid and organic on the board matters. You want to see organic rows improve while paid rows are optional, not the reverse.
Building a content row when you hate writing
You do not need twenty posts. You need one post that ranks for a phrase your buyer types when they are annoyed. Track that post on the board for twelve weeks even if signups are zero at week four. Note impressions from Search Console in the monthly appendix. At week eight, update the intro with language you stole from support tickets. At week twelve, if assisted signups are still zero, merge the post into a better sibling or delete it. The board prevents zombie content from living forever because you already published it once.
Community-sourced content counts too. A detailed reply you save as a public guide is a post. If it assists signups when linked, it belongs in the content row even if it lives on your docs subdomain instead of the blog. Marketing metrics should follow assets, not sitemaps.
The Friday ritual: thirty minutes, one sentence
The ritual is boring on purpose. Open the sheet at the same time each week. I like Friday at 4:30 p.m. because it is late enough that the week's data mostly landed, early enough that I can still send one outreach email if the board demands it.
Minute zero through ten: paste numbers from Stripe, ads, analytics, and your outreach log. Do not tweak formulas. Do not add charts. Paste.
Minute ten through twenty: compare week-over-week and note the top channel. Ask why the channel won. If you do not know, that is next week's first task, not a reason to add a seventh metric.
Minute twenty through twenty-five: color the rows. Write the next week sentence. One sentence. Examples I have actually written: "Pause broad match keywords until landing page ships new hero." "Reply to ten refund threads with the export guide link." "Rewrite post three intro; rankings fine, signups zero."
Minute twenty-five through thirty: schedule the one action on Monday's calendar. If it is not on the calendar, it will lose to code. Marketing loses to code by default. Calendar is how you cheat.
That is the whole ritual. No slide deck. No executive summary. One sentence is the summary.
Where I log qualitative signal
Numbers miss tone. Under the sheet I keep a "heard this week" bullet list: objections, exact phrases, competitor mentions, feature surprises. Three bullets max. This list feeds copy changes more often than any chart. It is not a sixth metric. It is a footnote so you do not pretend marketing is only math.
What I do when I want to skip Friday
I still want to skip sometimes. The product bug is more interesting. The board feels accusatory when trials are flat. The rule I use: you may skip one Friday per month if you write why in the sheet. Skipping without a note turns into skipping forever. The note is accountability without guilt theater.
When trials are flat and you skip anyway, you are usually afraid of the sentence. The sentence might be "talk to five users before more content." That is uncomfortable. It is also the job. The board is not punishment. It is a mirror with five numbers instead of a thousand.
When the weekly board says pivot the channel
Three red weeks in a row on the same channel is a pivot conversation, not a failure. It means the channel had a fair test and did not earn another month by default. Fair test means at least twenty meaningful attempts: twenty personalized emails, twenty community contributions with soft mentions, twenty ad creative iterations with consistent offer, or three published pieces targeting the same intent cluster.
Pivot does not always mean quit. Sometimes it means narrow. Broad LinkedIn posting failed; LinkedIn DMs to accountants worked. SEO for "invoice software" failed; SEO for "Shopify refund export" worked. The board's top-channel row tells you when the label stayed the same but the tactic inside the label changed.
Pivot can also mean pause paid while organic catches up. I have seen founders scale ads into a leaky trial because ROAS looked good on annual prepay while monthly churn quietly ate the back end. The board turned red on retention before marketing noticed. Cross-check with analytics before you blame the channel.
When you pivot, write the postmortem in five lines: what we tried, for how long, what counted as success, what happened, what we try next. Future you will otherwise repeat the experiment with amnesia.
Fair tests I have seen founders cheat
Cheating looks like changing the offer every week so no channel gets a stable story. Cheating looks like counting friends as qualified replies. Cheating looks like pausing ads after three days because ROAS was 0.8x once. Cheating looks like declaring SEO dead because a post did not rank in ten days. The board only works if you let channels fail slowly enough to learn and honestly enough to hurt a little.
Wiring tools without building a second product
You do not need a data warehouse. You need three inputs and one sheet. Stripe for revenue and new customers. Plausible or Google Analytics for traffic and campaign URLs. Your ad platform for spend. Optional: PostHog or Metabase for assisted signup paths if you already instrumented them.
Start with manual paste. Automation is a reward for keeping the ritual four weeks in a row, not a prerequisite. I have seen founders spend a weekend wiring Zapier before they proved they would open the sheet on Friday. The wiring became another project that felt like progress.
When you automate, automate paste only. Formulas for CAC and ROAS can live in the sheet. Alerts can ping you if spend exceeds a cap. Do not automate the sentence. The sentence is thinking.
Keep UTM discipline boring. One format. One spreadsheet tab that decodes it. utm_source, utm_medium, utm_campaign are enough. Fancy UTM taxonomies die when you are tired. Boring UTMs survive.
Attribution fights
Do not let perfect attribution block a good-enough board. Last-click undervalues content. First-click overvalues top-of-funnel fluff. Pick one model for twelve weeks and stick with it. Consistency beats precision at solo scale.
If you want deeper product numbers on another day, Max's analytics guide is the right room. This board is marketing acquisition and efficiency. Mixing rooms is how twelve tabs happen again.
A minimal stack that survived four products
Stripe dashboard for new customers and MRR movement. Plausible for top pages and campaign UTMs. Google Ads or Meta for spend export if you run paid. A Google Sheet with the five rows, a date column, a next-week sentence cell, and a heard-this-week cell. That stack costs under $50/month until you are meaningfully scaled. Everything else is optional seasoning.
When you outgrow manual paste, add one integration at a time. Stripe to sheet weekly. Ad spend to sheet daily with a spend-cap alert. PostHog assisted-path export if content is half your strategy. Do not add a BI tool because you feel behind. You are behind on decisions, not charts.
What good looks like at month three
By week twelve, a healthy board shows a few patterns. Top channel stops flipping every week because you committed. Qualified replies correlate with trial spikes seven to fourteen days later. Cash CAC trends down or stabilizes while fully loaded CAC is a choice you recognize. ROAS either stays above your gate or ads stay off on purpose. At least one content URL assists signups repeatedly.
You also get faster at the sentence. Early weeks the sentence is vague: "more outreach." Later weeks it is specific: "five DMs to Shopify sellers who mentioned refunds in r/ecommerce." Specificity is progress.
Month three is not "scale everything." It is "stop lying to yourself with tabs." Founders who reach month three with a honest board usually know whether marketing is a bottleneck or product is. That clarity is worth more than any single metric.
If month three still looks random, shrink further. Three numbers until patterns appear. A board you update beats a board you abandon.
When to add a sixth row
Add a sixth metric only when a single number repeatedly blocks decisions. Maybe referrals become half your trials and you need a dedicated referred-signups row. Maybe you run two paid platforms and need Meta separate from Google. Maybe international expansion forces a country split. The bar is high. Six rows is where boards go to die for solo founders who added "email subscribers" because it felt lonely.
Stay at five until the business complains. The business will complain loudly enough when the constraint hurts.
Questions solo founders ask about weekly marketing metrics
How often should a solo founder review marketing metrics?
Once a week is enough for most micro-SaaS products under a few hundred customers. A focused Friday review beats checking dashboards daily, because daily numbers at small scale are mostly noise and anxiety. Pick one thirty-minute slot, update five numbers, write one sentence about what changes next week, and close the laptop.
What marketing metrics matter most for a solo founder?
Five numbers cover most early-stage marketing: qualified replies or conversations from outreach, new trials or signups from your top channel, customer acquisition cost when you run ads, return on ad spend before you scale spend, and one content KPI that ties a specific post to a signup. Everything else is optional until volume justifies it.
How do I calculate CAC as a solo founder with a small ad budget?
Divide total marketing spend in the period by new paying customers acquired in that same period. Include ad spend, tool costs you would not buy without marketing, and a honest hourly rate if you count your time. If you acquired zero paying customers, CAC is undefined, not zero. That is useful information too.
What ROAS should I hit before scaling paid ads?
Most solo founders should not scale until ROAS consistently clears 1.5x on a thirty-day window, meaning every dollar in returns at least a dollar fifty in gross revenue before fees. Lower ROAS can work with high retention and annual plans, but you need enough data to know that. One good week is not a scale signal.
Which content KPIs predict future signups?
Track assisted signups per post, not pageviews alone. A useful content KPI is how many trials or signups credited a specific URL in the last thirty days, plus whether search impressions are growing for the keyword you targeted. A post that ranks but never assists a signup is a rewrite candidate, not a win.
Can I use the same weekly board for product and marketing metrics?
Marketing and product metrics answer different questions. Keep marketing on a Friday board focused on acquisition and channel efficiency. Product activation and churn belong on a separate weekly review, often on a different day. Mixing them in one session turns into dashboard tourism where nothing gets a decision.
The number I'll still check too often
I still peek at total MRR more than weekly marketing rules allow. MRR is not on the Friday board because it lags and blends product with acquisition. It is also the number that calms me when outreach felt like shouting into fog. I am not cured of dashboard tourism. I just gave it a smaller room.
Your board is not a personality test. It is a contract between present you and Monday you about what evidence counts. Twelve tabs let you hide. Five numbers make you choose. Pick the five that force a next action, pick a Friday slot, and write the sentence before you open Twitter again. That is the whole trick. Boring, repeatable, and enough to build a real business without a marketing team behind the curtain.




Comments